
New Conn. high school graduation rates show continuing economic gap; some progress
Posted: May 14, 2014 Filed under: Education Leave a comment »The Connecticut Department of Education released new statistics on Wednesday showing an improvement in the percentage of students who graduate in four years, and a slight reduction in the gap based on the economic background of students.
In 2013, 68.6 percent of students who are eligible for a free lunch (the standard way of assessing poverty in schools) graduated in four years. In 2012, that percentage was slightly lower, at about 66 percent. For those who get a reduced-price lunch in 2013, 84.2 percent graduated in four years. Compare that to the percentage for kids whose families make enough money that they don’t qualify for any lunch assistance: 93.3%.
Last year’s numbers were released in August, and were featured here in State of Disparity.
Here’s an interactive map by the Connecticut State Data Center, illustrating graduation rates in each Connecticut school district.

Since 2010, the graduation gap between economically disadvantaged students and their more affluent peers reduced by 4.5 percentage points (17.5 percent).
The DOE has set aside the 30 lowest performing school districts in a designation called “Alliance Districts” that are getting additional funding. Those districts saw a 1.3 percent increase over 2012. Of those, the 10 lowest performing saw a 2.8 percentage-point increase — from 66.3 percent in 2012 to 69.1 percent in 2013.
Four-year graduation rates by district and school are available at the following links: District, School
Of course, if a student doesn’t graduate in four years, it doesn’t necessarily mean they won’t graduate at all (as we saw in this story). So the DOE also released, for the first time, the percentage of students who graduate in five years.
Looking at all students who entered Grade 9 in September 2008 (so they ordinarily would have graduated in 2012) the five-year graduate rate is 87.5 percent – 2.7 percentage points higher than the cohort’s four-year rate. For kids who are
eligible for free or reduced-price lunch, adding that extra year brings up the graduation rate 5.3 percentage points.
Five-year cohort graduation rates by district and school are available at the following links: District, School
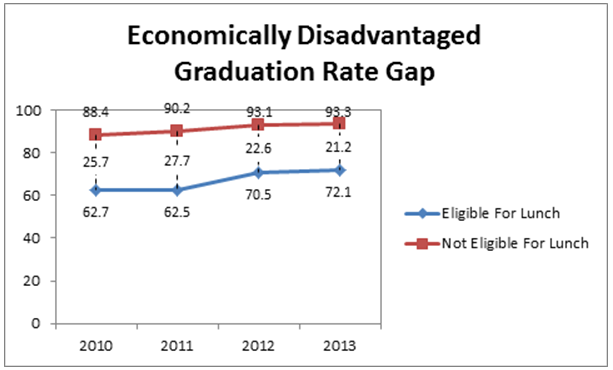
This graph from the Conn. Department of Education shows a continuing significant gap in graduation rates between students who qualify for free or reduced-price lunch, and those that don’t. Although the state points out the gap decreased from a 25.7 percentage-point difference in 2010 to a 21.2 percentage-point difference in 2013 for a total reduction of 4.5 points.
There are persistent racial gaps in grad rates, too. In 2013, about 91 percent of white students graduated in four years, while about 76 percent of black students and 70 percent of Hispanic students graduated in the same time.
Listen to Ebong Udoma’s story here:
Recent Comments